Overview
Ribosome Profiling
Ribosome profiling utilizes Next Generation Sequencing (NGS) to provide a detailed picture of the protein translation landscape within cells. Cells are lysed, translating ribosomes are isolated, and the ribosome protected mRNA fragments (ribosome footprints are integrated into a SE RNA-seq library. The library is then sequenced and processed similarly to a single-end RNA-seq run, with some exceptions:
5’ and 3’ ribosome footprint bias
Footprint read pile-up at the 5’ and 3’ ends of transcripts is a well-documented phenomenon in ribosome profiling. This results from the kinetically slower translation initiation and termination steps, thus leading to higher density of ribosomes at these positions. Therefore, it is best to quantify reads by excluding the extremities of transcripts from consideration. The convention is to remove the first 45 nt and last 15 nt of each transcripts coding space. By using the
xpresspipe modifyGTF or xpresspipe curateReference sub-modules with the flag -t provided, the user can prepare the required files for appropriate footprint quantification.rRNA contamination
Ribosome footprinting involves RNase digestion of a RNA. As these footprints are protected by the ribosome, they evade digestion and can later be incorporated into a sequence library. However, this leads to much of the ribosomal RNA being digested and fragments carrying through with the footprint samples. Commercial kits are often unable to target many of these randomly fragmented rRNA species, and it is thus advised to create depletion probes for dominant rRNA fragment species in ribosome profiling libraries for a given organism. By using the
xpresspipe rrnaProbe sub-module, one can determine what the dominant consensus rRNA species are and create depletion probes to prevent their incorporation into future sequence libraries.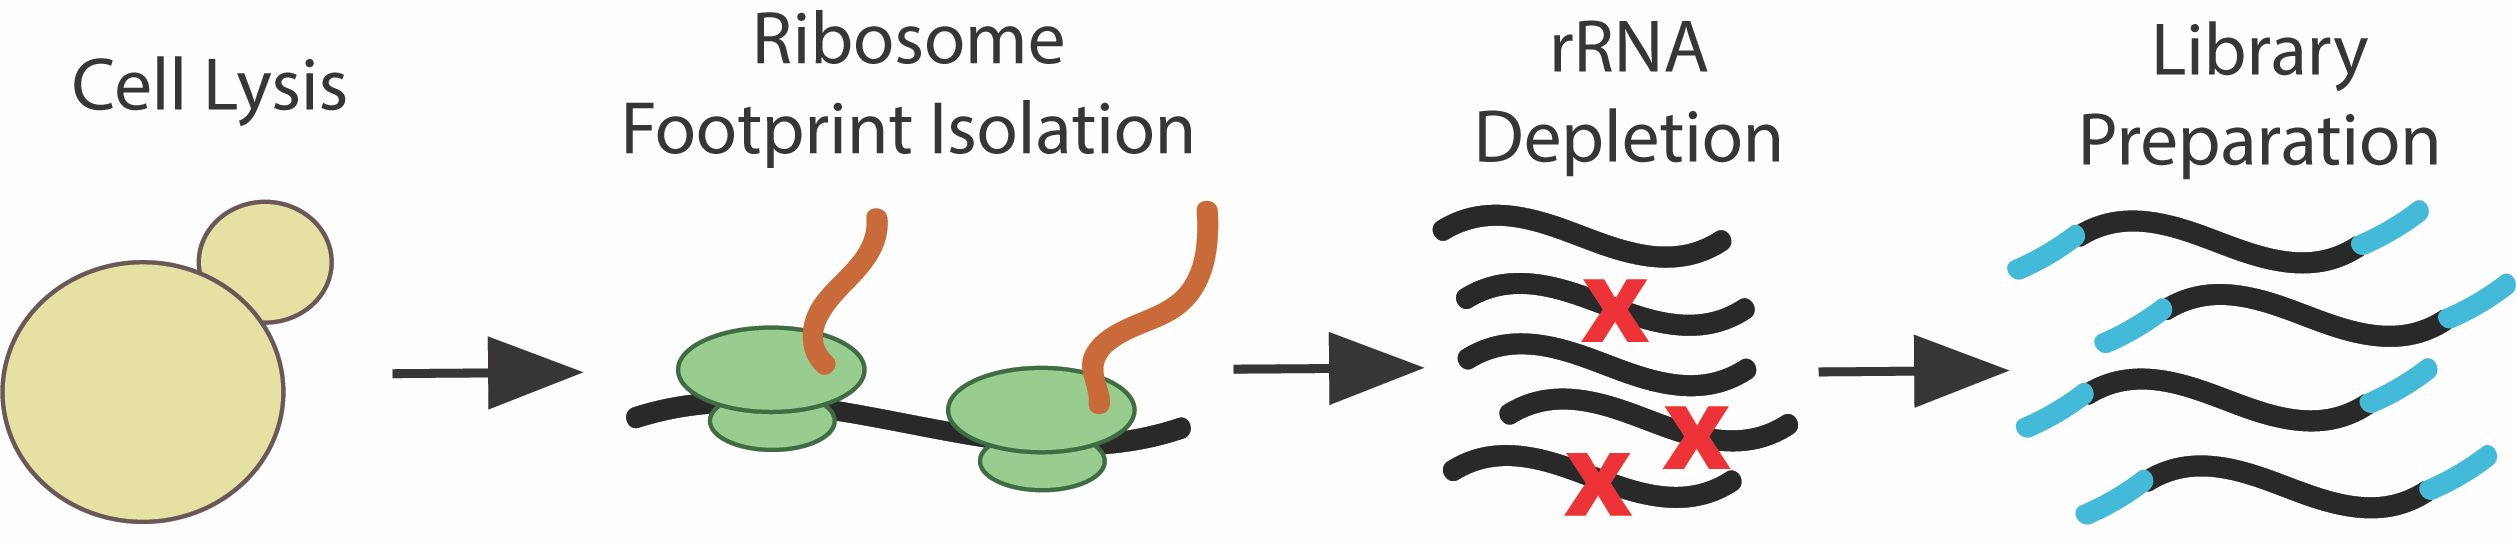
SE and PE RNA-seq
The XPRESSpipe pipeline is flexibly designed to be able to process and perform preliminary analyses on single-end (SE) or paired-end RNA-seq sequence read. Raw data is most often generated in the form of a .fastq or .txt file. This data is useful in determining the gene expression landscape of a population of cells. Other qualities, such as microRNA abundance, splice events, and sequence variants can also be detected and analyzed.
Software
XPRESSpipe aims to use the curate the most current and robust software packages required to process and analyze ribosome profiling and bulk RNA-sequencing. In designing XPRESSpipe, we referred to a variety of benchmarking studies to determine the best option for this pipeline. Below is a rationale for many of the packages chosen. As software continues to improve and benchmarking studies are published, XPRESSpipe and its documentation will be updated to reflect these improvements.
fastp
fastp source – Read pre-processing
While external benchmarking has not been performed to our knowledge in recent years on read pre-processing tools, we chose to use fastp as it is fast, and (at least from self-reports) has reliable output. While most read pre-processing software does not diverge significantly in quality, we also favored fastp as it is able to handle more recent trends in RNA-Seq, such as trimming of unique molecular identifiers (UMIs).
STAR
STAR source – Masking and Alignment
A recent benchmarking paper showed that STAR outperformed other comparable tools in speed and performance, increasing the number of correctly aligned reads, while reducing the number of falsely called reads as is the case with several other packages.
Samtools, bedtools, deepTools
These tools handle the alignment file processing before quantification to identify PCR amplification artifacts (optional), remove non-uniquely aligned reads, and so on.
HTSeq
HTSeq source – Read Quantification
HTSeq is used as it is a thoroughly vetting read counting package that has stood the test of time. Additionally, it is employed in the TCGA pipeline, thus we included this option to conform to these specifications. In the case of quantifying reads, HTSeq is very accurate and has the advantage of being able to quantify to specific gene features. This is particularly useful in ribosome profiling as it allows you to quantify reads to the protein coding space (CDS) of a transcript. Additionally, if one wanted to examine differences in uORF occupancy of ribosome footprints, they could specify
five_prime_utr or three_prime_utr for the --feature_type option.Cufflinks
Cufflinks source – Read quantification (Isoform abundance)
A recent benchmarking paper showed evidence that Cufflinks using default parameters performed the best compared to several other read quantification tools.
XPRESSpipe uses Cufflinks v2.1.1 as Cufflinks v2.2.1 appears to suffer from a persistent Seg Fault 11 error on MacOS. No significant changes effecting quantification have occurred between these versions. v2.1.1 is downloaded automatically for the user during installation of XPRESSpipe.
dupRadar
dupRadar source – Library Complexity
dupRadar is a stable, easy to use tool for estimating library size complexity and doesn’t suffer from systematic software issues like other tools that contain similar functionality.
riboWaltz
riboWaltz source – P-site distribution/periodicity analysis
riboWaltz offers to date perhaps the most elegant and complete method for P-site calculation and offers a complete suite of all P-site related utilities needed for ribosome profiling analysis.
SVA
SVA source – Known Library Batch Correction
Used for correcting for known batch effects between samples (i.e. samples prepared on different days, by different people, etc.)
DESeq2
DESeq2 source – Differential Expression Analysis
Perform differential expression analysis on the data.
MultiQC
MultiQC source – Summary reports
MultiQC gathers log output from fastp, STAR, and HTSeq/Cufflinks to provide the user with a easy to view summary of their processed data at each step. A pipeline run will also FastQC
Methodology
We seek to provide the best methodology for high-throughput sequencing processing, and explain key components below.
Transcriptomic Reference Files
Read quantification often requires a transcriptome reference file in order to know what alignment coordinates map to what genes. We introduce a suite of GTF modification tools included in XPRESSpipe that we will briefly discuss:
- Isoforms: GTF files contain records for every isoform of a gene. However, since these isoforms all contain overlapping regions, many tools count a read mapping to one of these regions as a multi-mapper and either penalizes it or discards it completely. A common way to handle this is by taking only the longest transcript for each gene during quantification. This can be performed with
xpresspipe modifyGTF -l.- Protein Coding: When calculating mRNA expression levels, sample normalization to reduce technical bias from RNA-seq platforms is important. However, highly-abundant rRNAs can confound these metrics. Therefore, we provide an option to create a GTF file with only protein-coding annotated genes as input for quantification using
xpresspipe modifyGTF -p.- Ribosome Profiling Bias: During translation, there are three steps: 1) Initiation, 2) Elongation, and 3) Termination. There is usually a pause during Initiation and Termination, which will present itself as systematic spikes on the 5’ and 3’ ends of each transcript for ribosome profiling reads. A way to correct for the kinetics of initiation and termination and measure translational capacity itself is to avoid mapping reads to the first 15 codons and last 5 codons of a transcript.
xpresspipe modifyGTF -t handles this by searching the exon space of each transcript and pruning the given amounts off of each so that these regions are considered non-coding space. This process is performed recursively, so that if you were trimming 45 nt from the 5’ end and exon 1 was only 30 nt, exon 1 would be removed and exon 2 would be trimmed by 15 nt.PCR De-Duplication
During sequence library creation, a PCR amplification step is common in order to produce enough sequence material, but often, different reads are amplified differentially. When UMIs are not used, these duplication events can lead to artificially higher expression of a transcript. We therefore include an optional PCR de-duplication step for experiments not using UMIs. Be warned, this can introduce additional biases and should be used with caution. Performing library complexity analysis on the samples should indicate whether or not computational de-duplication should be performed. If UMIs were used, these can be specified and will be handled by the pipeline.
Meta-Analysis
Read distribution: Once reads are trimmed of low quality bases or adapter sequences, looking at the distribution of read lengths can be helpful in identifying that the expected RNA was incorporated into the library. This is especially useful in ribosome profiling datasets, where ideally all reads isolated and incorporated into the library should fall within the 21-33 nt range.
Metagene: Metagene analysis takes the read coverage across all transcripts in a sample and compiles their distribution along a representative transcript. This is useful in identifying any systematic 5’ or 3’ biases in the library preparation step.
P-Site Statistics: Helpful metrics of ribosome profiling libraries including looking at the characteristic 3 nt/1 codon stepping of the translating ribosome and codon usage per sample.
Gene Coverage: Aspects of a transcript’s read coverage or occupancy can be of interest. However, other genome browsers like IGV retain introns, and in the case of transcripts with massive introns, the actually coding space will be difficult to analyze succinctly. XPRESSpipe will plot the gene coverage across an exon-only transcript representation. However, it may still be worthwhile to explore intron coverage in some instances.