Quality Control
Read Distribution Analysis
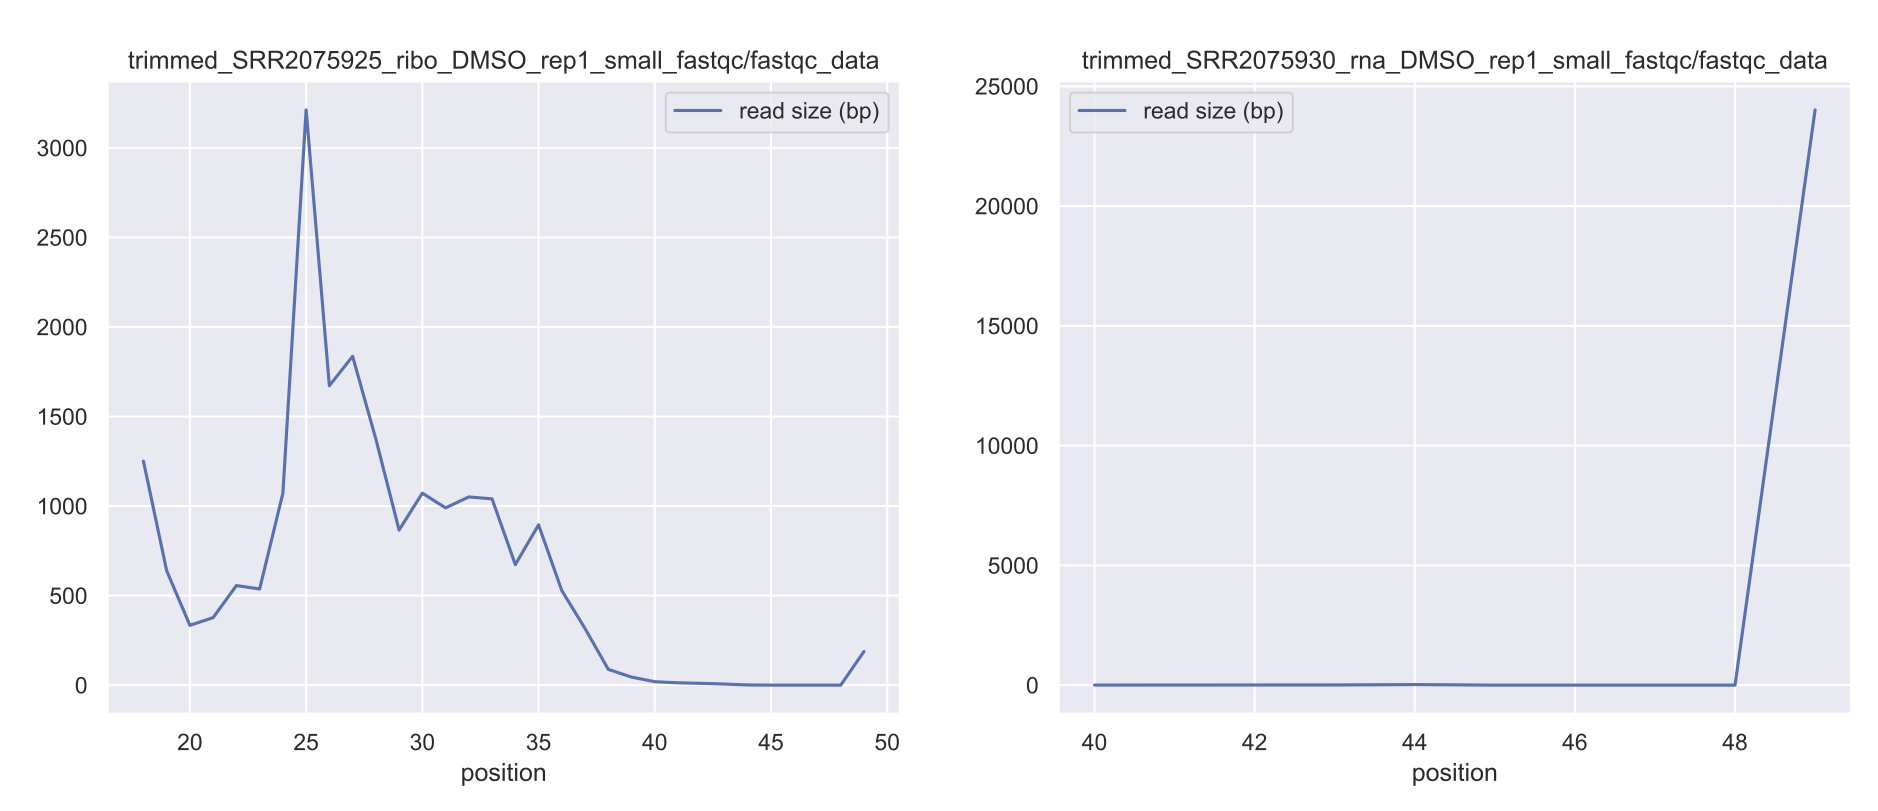
When performing RNA-seq, your sequencing library population is important to assess to ensure a quality sequencing run. Unexpected populations can be indicative of RNA degradation or other effects. In ribosome profiling, the expected footprint size is ~28-30 nucleotides, so you would expect a peak in this region when running your analysis. The following module will run read distribution analysis for all
fastq samples within a given directory. It is recommended this analysis be performed on trimmed reads to clean up adapters and get the true distribution of sequence reads in the library. When this is run within the pipeline, it will analyze just the post-trimming fastq files.Additionally, if running one of XPRESSpipe’s pipelines, you can refer to the MultiQC
html file for general summary statistics, which include read length distributions for all samples.Arguments
The help menu can be accessed by calling the following from the command line:
$ xpresspipe readDistribution --help
| Required Arguments | Description |
|---|---|
-i <path>, --input <path> |
Path to input directory of trimmed fastq (or untrimmed fastq) files |
-o <path>, --output <path> |
Path to output directory |
| Optional Arguments | Description |
|---|---|
--suppress_version_check |
Suppress version checks and other features that require internet access during processing |
-t <SE or PE>, --type <SE or PE> |
Sequencing type (“SE” for single-end, “PE” for paired-end) |
-e <experiment_name>, --experiment <experiment_name> |
Experiment name |
-m |
Number of max processors to use for tasks (default: No limit) |
Example 1: Analyze read distributions from ribosome profiling libraries
$ xpresspipe readDistribution -i riboprof_out/trimmed_fastq -o riboprof_out -e se_test
Metagene Analysis
Analyze each sequencing sample to ensure equal distribution of reads across all transcripts. Can be useful in identifying 5’ or 3’ biases in sequence preparation.
Requires a transcriptome-mapped BAM files, which can be output by STAR and are automatically output during any XPRESSpipe alignment run.
$ xpresspipe metagene --help
| Required Arguments | Description |
|---|---|
-i <path>, --input <path> |
Path to input directory of transcriptome-mapped BAM files |
-o <path>, --output <path> |
Path to output directory |
-g </path/transcripts.gtf>, --gtf </path/transcripts.gtf> |
Path and file name to un-modified reference GTF |
| Optional Arguments | Description |
|---|---|
--suppress_version_check |
Suppress version checks and other features that require internet access during processing |
-e <experiment_name>, --experiment <experiment_name> |
Experiment name |
--feature_type <feature_type> |
Specify feature type (3rd column in GTF file) to be used in calculating metagene coverage (default: exon; alternative: CDS) |
--bam_suffix <suffix> |
Change from default suffix of toTranscriptome.out.bam if transcriptome-mapped files were processed outside of XPRESSpipe |
-m <processors>, --max_processors <processors> |
Number of max processors to use for tasks (default: No limit) |
Example 1: Analyze metagene profiles of sequence libraries
- Use default transcript reference (maps to all transcripts, even if non-coding)
$ xpresspipe metagene -i riboprof_out/alignments/ -o riboprof_out -g se_reference/transcripts.gtf -e se_test
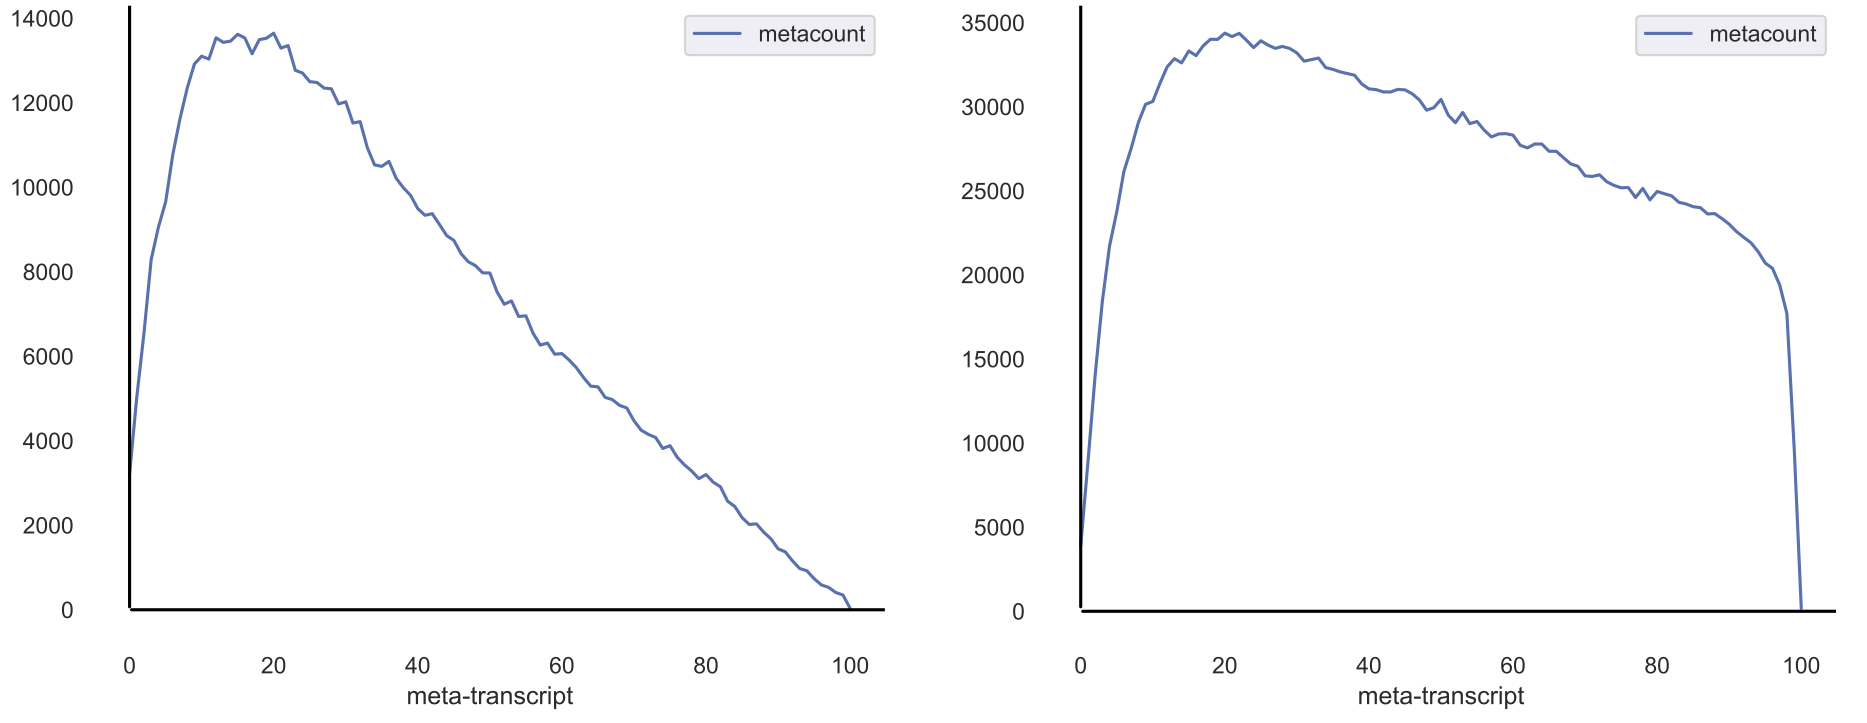
Note
As you can probably see, there are systematic 5’ biases in these library preparations. A good RNA-seq library should generally have even coverage across all transcript positions.
Intron-collapsed Gene Coverage Analysis
Plot the coverage of a given gene for a sample or set of samples with introns collapsed.
$ xpresspipe geneCoverage --help
| Required Arguments | Description |
|---|---|
-i <path>, --input <path> |
Path to input directory of transcriptome-aligned BAM files |
-o <path>, --output <path> |
Path to output directory |
-g </path/transcripts.gtf>, --gtf </path/transcripts.gtf> |
Path and file name to reference GTF |
-n <gene_name>, --gene_name <gene_name> |
Gene name (case sensitive) |
| Optional Arguments | Description |
|---|---|
--suppress_version_check |
Suppress version checks and other features that require internet access during processing |
-e <experiment_name>, --experiment <experiment_name> |
Experiment name to save output summaries as |
--bam_suffix <suffix> |
Change from default suffix of toTranscriptome.out.bam if using a different BAM file |
--type <type> |
Record type to map across (i.e. “exon”, “CDS”) (case-sensitive) |
--samples <sample_list> [<sample_list> ...] |
Provide a space-separated list of sample names to include in analysis (will only include those listed, and will plot in the order listed) |
--sample_names <suffix> |
Provide a space-separated list of sample names to use for labels |
--plot_color <color> |
Indicate plotting color |
-m <processors>, --max_processors <processors> |
Number of max processors to use for tasks (default: No limit) |
Example 1: Analyze gene coverage profile of sequence libraries
- Use default transcript reference (will generate a longest transcript-only reference)
- Analyze SLC1A1
- Analyze along chosen record type (default: exon, but could also use CDS if looking at ribosome profiling data)
- Analyzing BAM files ending in
sort.bam- Specifying names to use in plotting – if not using
--samples, these files will be plotted alphabetically, so the listed order should also be alphabetical. If using --samples, need to specify names in the same order you provided for this argument.$ xpresspipe geneCoverage -i /path/to/bam_files -o ./ -g /path/to/reference.gtf \
-n SLC1A1 --type exon --bam_suffix .sort.bam \
--sample_names SRR1795425 SRR1795433 SRR1795435 SRR1795437
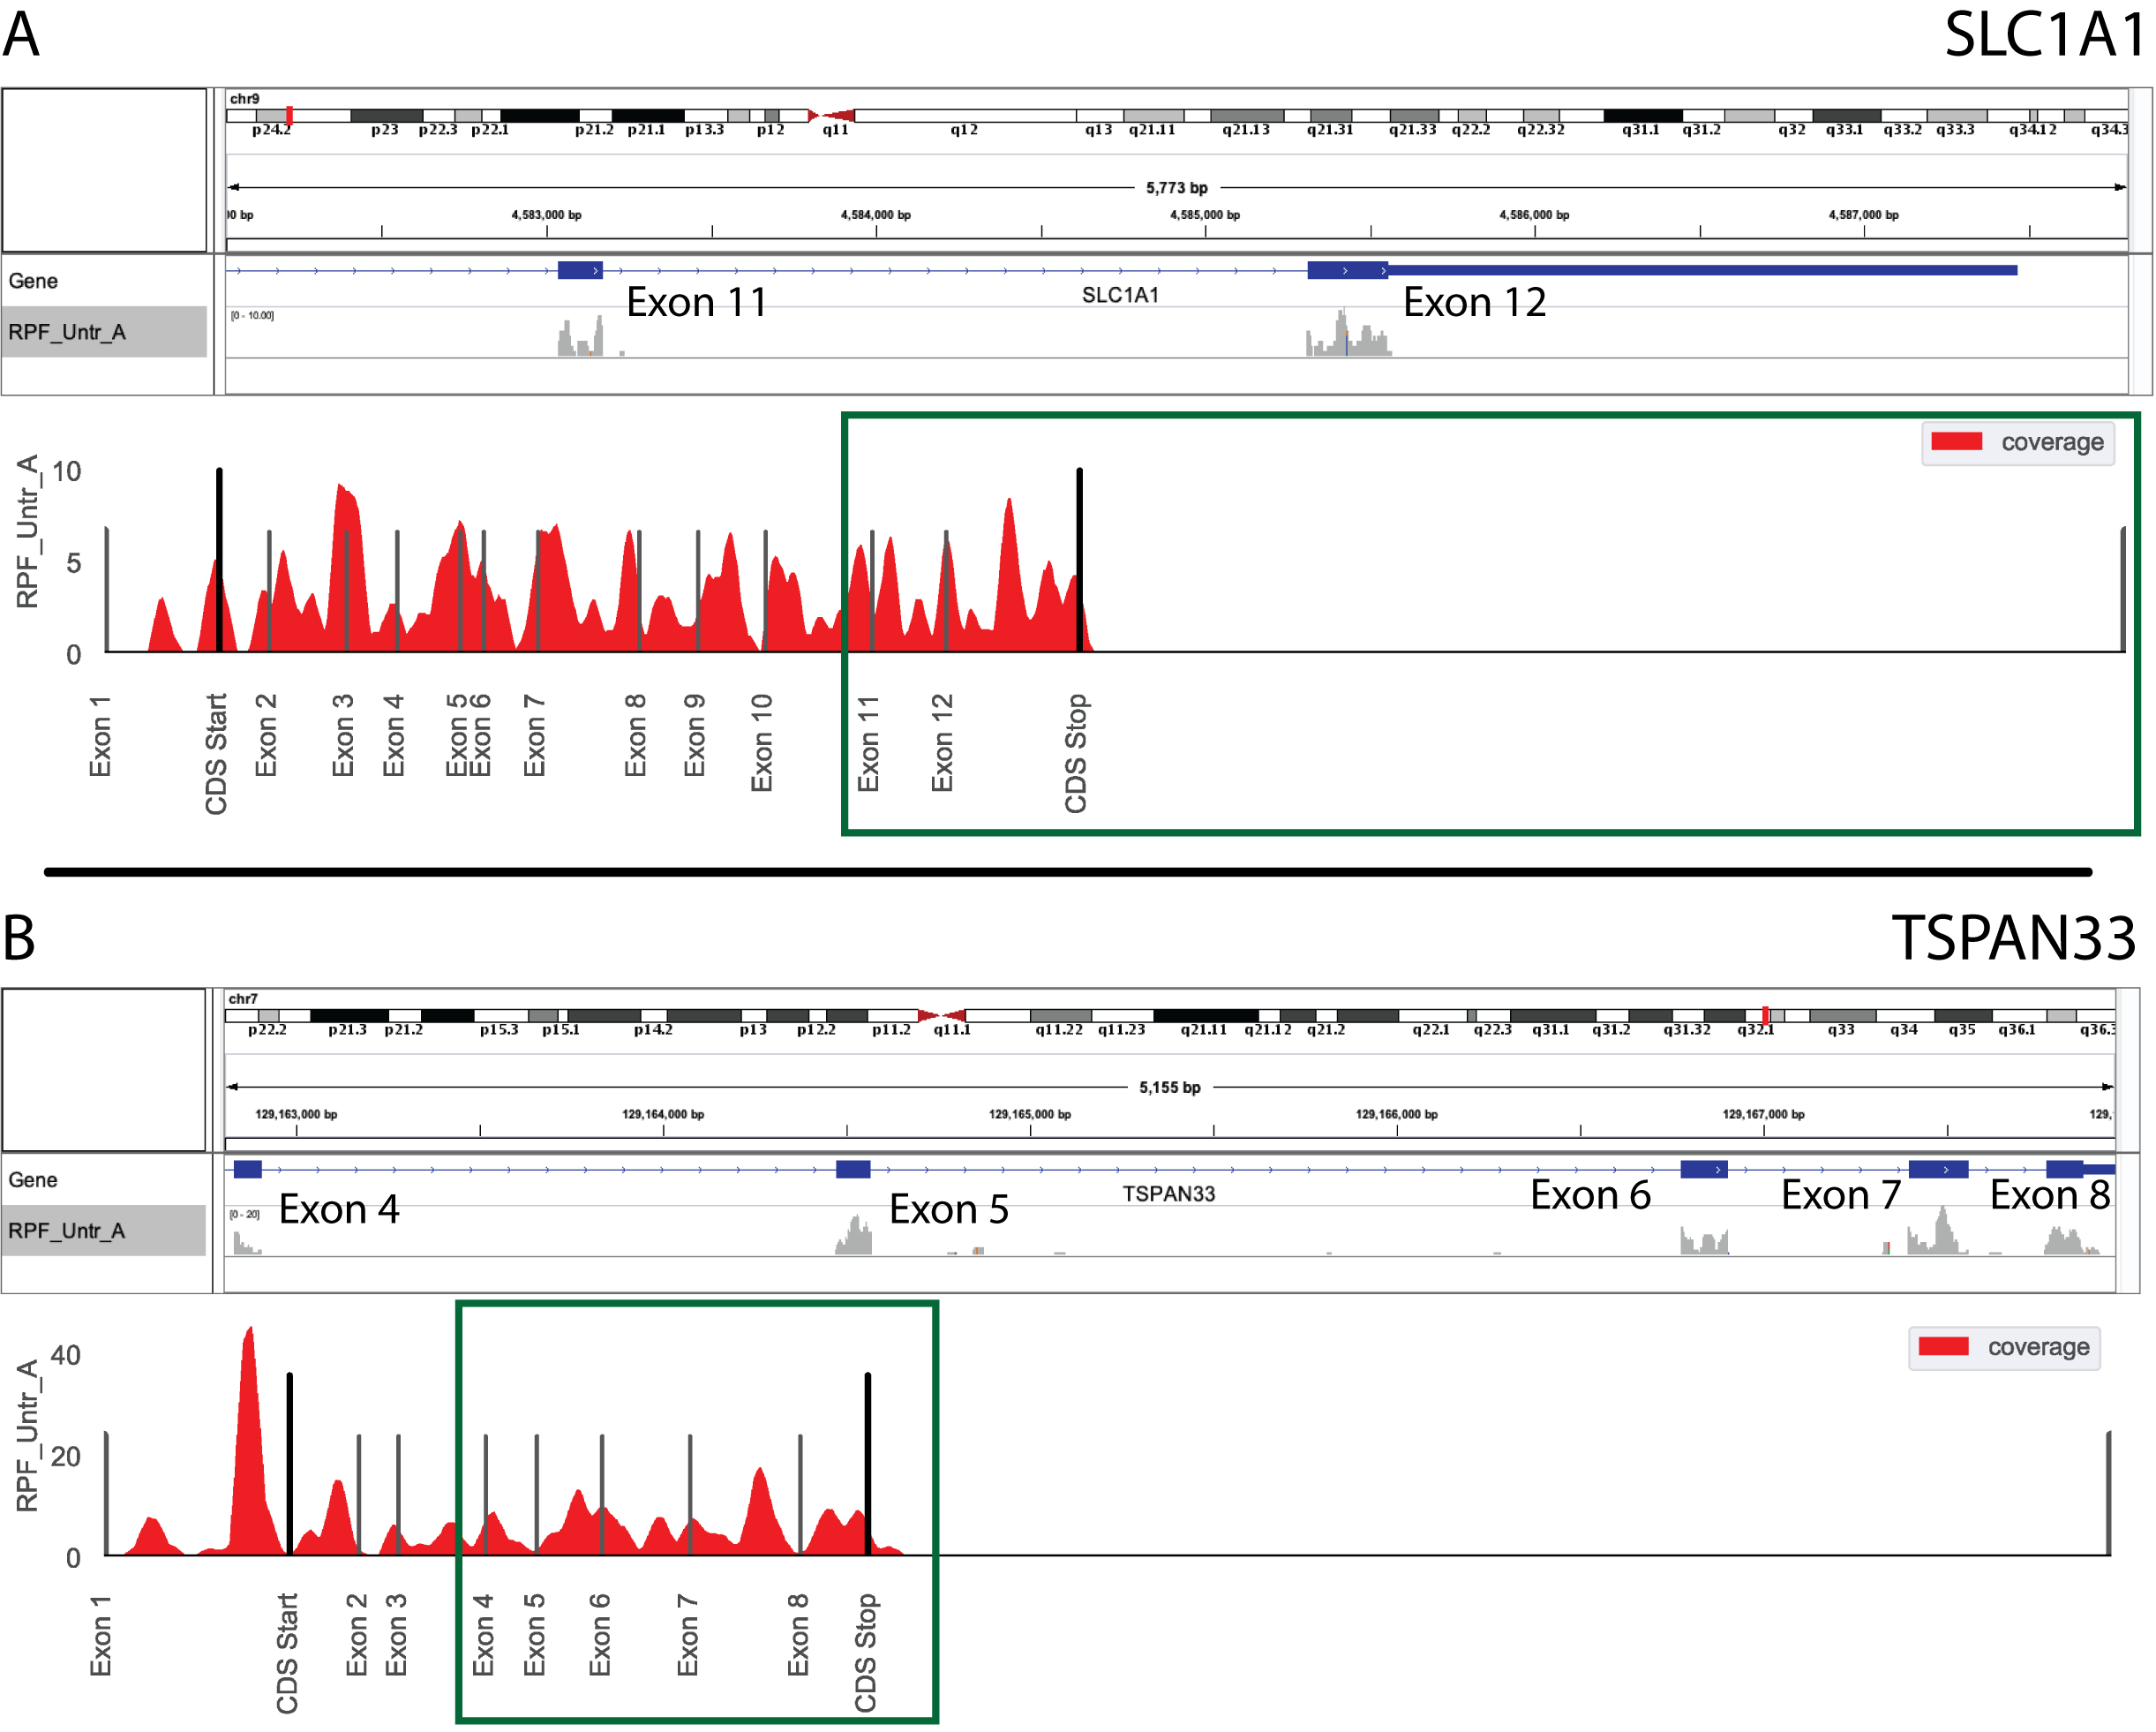
Note
The coverage estimations use a 20 nt rolling window mean method to smoothen the coverage plots. In both A and B in the image above, the top plot was generated with IGV (https://software.broadinstitute.org/software/igv/) and the bottom with xpresspipe geneCoverage. Green boxes show approximately the same region for comparison.
P-site Analysis
Analyze P-Sites. Useful in ribosome profiling samples for identifying that ribosomes are taking the expected 3 nucleotide steps along a transcript. If this is not apparent from the analysis, it may be indicative of poor sequence coverage of the ribosome profiling libraries.
$ xpresspipe p_sites --help
| Required Arguments | Description |
|---|---|
-i <path>, --input <path> |
Path to input directory of transcriptome-aligned BAM files |
-o <path>, --output <path> |
Path to output directory |
-g </path/transcripts.gtf>, --gtf </path/transcripts.gtf> |
Path and file name to reference GTF |
-cdna_fasta </path/cdna_fasta.fa> |
Path and file name to reference cDNA FASTA file for P-site reference generation/location |
| Optional Arguments | Description |
|---|---|
--suppress_version_check |
Suppress version checks and other features that require internet access during processing |
--min_length <length_value> |
Minimum read length threshold to keep for reads (default: 17) |
--max_length <length_value> |
Maximum read length threshold to keep for reads (default: 0). Setting this argument to 0 will result in no upper length limit. |
-e <experiment_name>, --experiment <experiment_name> |
Experiment name to save output summaries as |
--bam_suffix <suffix> |
Change from default suffix of toTranscriptome.out.bam if using a different BAM file |
-m <processors>, --max_processors <processors> |
Number of max processors to use for tasks (default: No limit) |
Example 1: Analyze P-sites from ribosome profiling libraries
$ xpresspipe p_sites \
  -i riboprof_out/alignments \
  -o riboprof_out \
  -g se_reference/transcripts.gtf \
  -e se_test